Products
Solutions
Resources
9977 N 90th Street, Suite 250 Scottsdale, AZ 85258 | 1-800-637-7496
© 2024 InEight, Inc. All Rights Reserved | Privacy Statement | Terms of Service | Cookie Policy | Do not sell/share my information

The Risk Histogram visualizes results from numerous iterations made using the distributions assigned to line items. Click on the Risk histogram icon next to any line item to report against that point in the project.
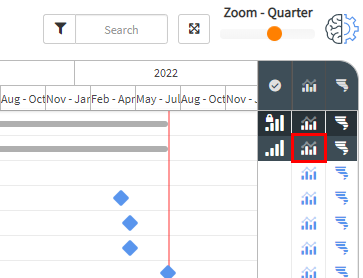
By clicking on the Risk histogram icon at the top level, you can report on the total project, as shown below.
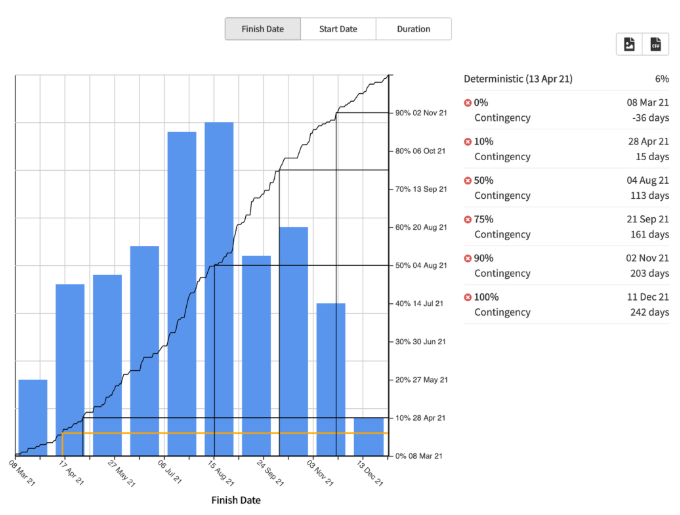
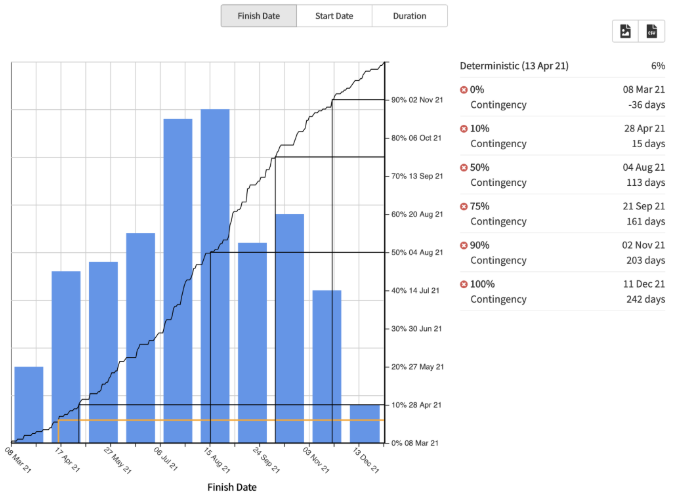
Blue bars indicate the number of iterations that land on a specific date; for this example, finish date. The information on the right provides insight into the probability of hitting the deterministic end date and indicate which dates align with various P-values. This example shows the following:
Additional Information
9977 N 90th Street, Suite 250 Scottsdale, AZ 85258 | 1-800-637-7496
© 2024 InEight, Inc. All Rights Reserved | Privacy Statement | Terms of Service | Cookie Policy | Do not sell/share my information